Key Takeaways
- Data-Driven Growth: Unlock hidden search queries and performance trends using the Performance Report to find low-hanging optimization opportunities.
- Flawless Indexation: Diagnose and resolve structural errors instantly using the Index Coverage status and the URL Inspection tool.
- User Experience First: Monitor and refine Core Web Vitals and mobile usability scores to meet modern search algorithm benchmarks.
- Strategic Optimization: Identify high-impression, low-click keywords to quickly improve click-through rates by rewriting meta elements.
- Proactive Security: Protect your site’s digital reputation by consistently monitoring the Manual Actions and Security Issues tabs.
- Actionable Insights: Submit clean XML sitemaps to accelerate the discovery and crawling of fresh or updated content assets.
Imagine steering a massive ship across an open ocean without a functional compass, a radar system, or a depth finder. Many business owners and marketing teams treat their organic search strategy exactly like this blind voyage. They publish new content regularly, adjust their on-page configurations, and pray that their organic visibility spikes.
WordPress SEO Services help improve your website’s visibility, rankings, and organic traffic. From on-page optimization and keyword targeting to technical SEO and performance improvements, professional WordPress SEO ensures your site attracts more visitors and achieves sustainable online growth.
Yet, they remain entirely unaware of what is actually happening beneath the surface of the search results pages. They miss technical indexing blockages, overlook critical crawling errors, and fail to track the explicit queries pushing users to their web properties.
This is where Google Search Console changes everything. As a completely free platform provided directly by Google, it serves as the ultimate diagnostic window into your website’s performance. It tells you exactly how the world’s largest search engine crawls, indexes, interprets, and ranks your digital assets.
In this comprehensive Google Search Console guide, we will unpack the precise methodologies required to transition from a casual data checker to an absolute search analytics expert. Whether you want to fix indexing anomalies, extract hidden keyword opportunities, or continuously improve website rankings, this playbook covers it all.
Setting Up Google Search Console for Success
Before extracting actionable insights from your search data, you must establish an accurate verification foundation. Skipping or rushing through the property setup phase leads to fragmented metrics, missing subdomains, or incomplete traffic pictures that distort your overarching marketing decisions.
Choosing the Right Property Type
When adding a new asset to your dashboard, you are met with two distinct choices: a Domain Property or a URL-Prefix Property. Understanding the architectural differences between these two options dictates how comprehensively your search performance is measured.
A Domain Property captures all data across all subdomains (such as blog.yourdomain.com, shop.yourdomain.com), as well as both secure (https) and non-secure (http) protocols. It provides a global look at your entire digital footprint.
Conversely, a URL-Prefix Property only tracks data for an exact protocol and matching path string. If you verify [https://yourdomain.com](https://yourdomain.com), you will miss traffic hitting [https://blog.yourdomain.com](https://blog.yourdomain.com) or the http variant.
| Property Feature | Domain Property | URL-Prefix Property |
| Data Scope | Aggregates all subdomains and protocols | Restrained to exact specified URL path |
| Verification Method | DNS Text Record modification only | HTML file upload, Meta tag, GA4, GTM, DNS |
| Best Used For | Holistic, agency-level brand tracking | Granular tracking of specific language folders or sub-sections |
Step-by-Step DNS Verification
To configure a Domain Property properly, you must prove ownership via your Domain Name System (DNS) provider. Follow these exact steps to avoid common verification delays:
- Copy the unique TXT record provided within the setup prompt.
- Log into your domain registrar dashboard (e.g., GoDaddy, Namecheap, Cloudflare).
- Navigate to the advanced DNS zone settings panel for your target domain.
- Add a new record entry, setting the type explicitly to TXT.
- Set the host or name field to
@and paste the unique string into the value field. - Save the record and wait up to 10–15 minutes for global propagation before clicking “Verify.”
Connecting to Google Analytics 4 (GA4)
Data isolated in a vacuum loses its strategic power. By linking your console property directly with Google Analytics 4, you bridge the gap between user discovery and on-site behavior.
Navigate to the Admin panel in your GA4 instance, scroll down to Product Links, and select Search Console Links. Choose your verified property to complete the integration.
Once linked, you can view specialized search queries and landing page acquisition data directly inside your core analytics dashboard. This makes it easy to tie search impressions to real-world conversion actions.
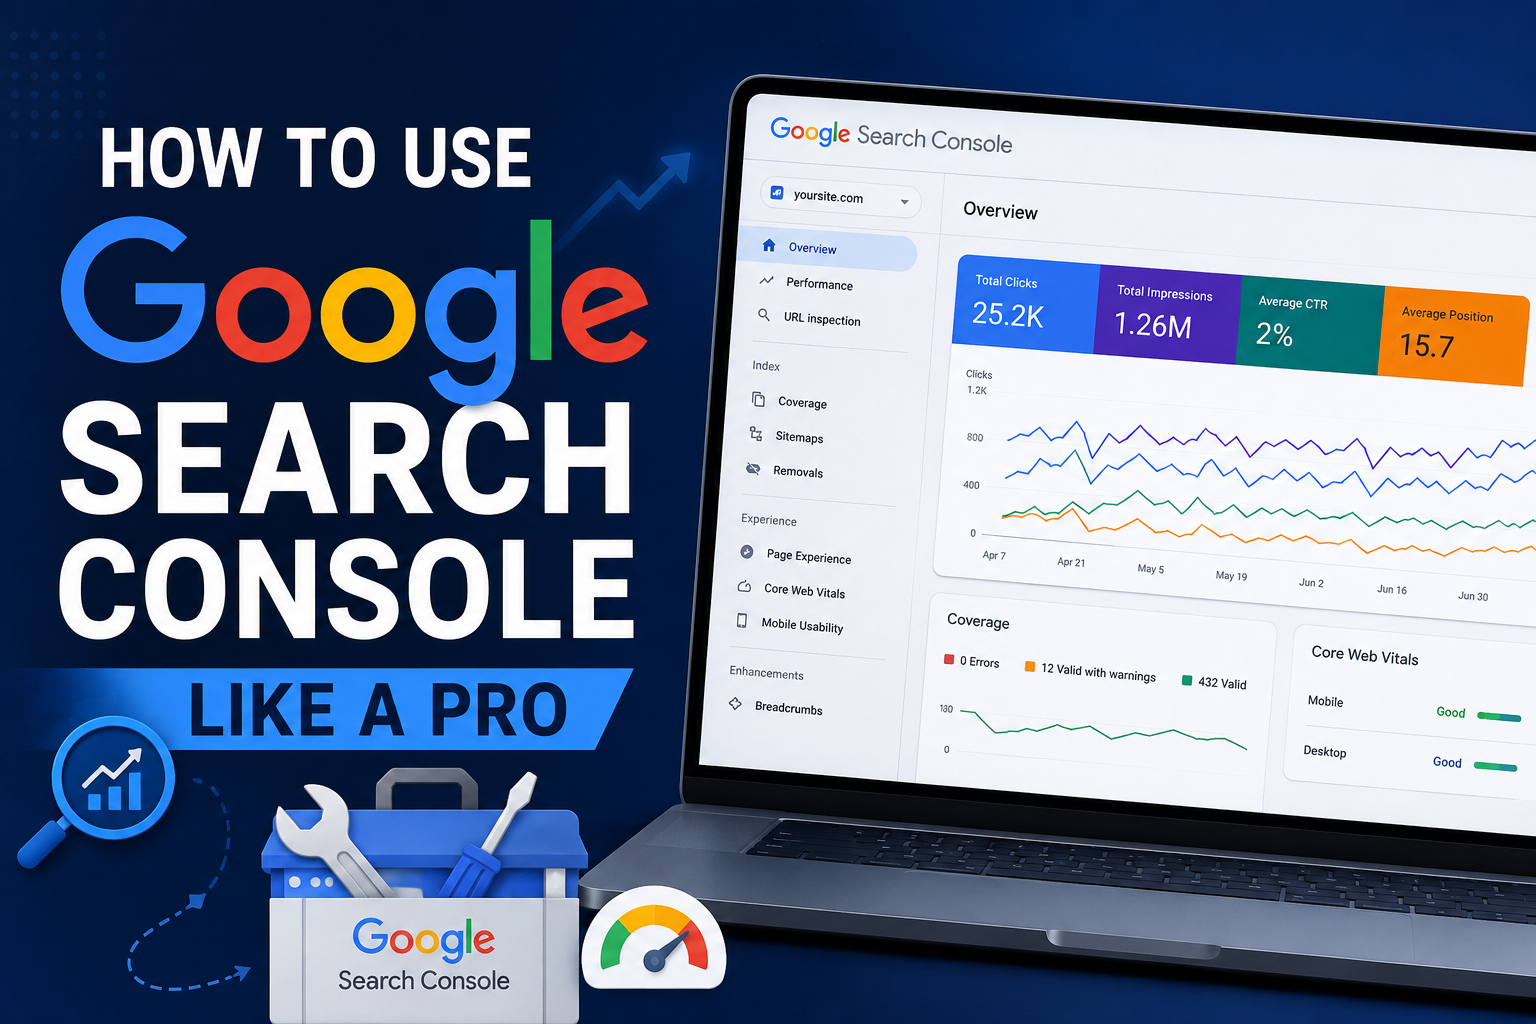
Navigating the Search Console Performance Report
The Search Console performance report acts as the core engine room for your organic optimization efforts. It provides a goldmine of historical behavioral indicators that reveal exactly how target audiences discover your platform across desktop, mobile, and image searches.
+--------------------------------------------------------+
|               PERFORMANCE METRICS OVERVIEW              |
+--------------------------------------------------------+
|  [ Total Clicks ]   -->  Users entering your website   |
|  [ Total Imps ]     -->  URLs appearing in SERPs       |
|  [ Average CTR ]    -->  Click-through efficiency rate |
|  [ Avg Position ]   -->  Blended ranking placement     |
+--------------------------------------------------------+
Deciphering the Core Metrics
To run a sophisticated website performance tracking routine, you must first master the interdependencies of the four foundational metrics tracked on this main screen:
- Total Clicks: The definitive count of search engine users who clicked through from a Google search result directly into your domain ecosystem.
- Total Impressions: The number of times any URL from your verified property appeared within a user’s active search results view, even if they did not scroll far enough to physically see the link.
- Average CTR (Click-Through Rate): Calculated via the simple formula: $\text{CTR} = (\text{Clicks} / \text{Impressions}) \times 100$. This percentage measures your site’s ability to turn impressions into real traffic.
- Average Position: The average numerical ranking slot your URLs occupy across all queries. If one query ranks at position 2 and another at position 10, your blended position shows as 6.
Applying Custom Filtering
The default, aggregated view often obscures highly valuable, localized search patterns. To uncover true user intent, you must regularly leverage the filter bar at the top of the performance report window.
By filtering by Query, you can segregate branded searches (queries containing your company name) from non-branded searches. This separation gives you an accurate view of your true content marketing reach.
Filtering by Page isolates specific high-value service directories or resource silos, allowing you to monitor product-specific visibility trends. You can also filter by Country or Device Type to pinpoint localized loading delays or cultural keyword variants that demand tailored regional optimization.
Actionable Tip: Create a custom regex (regular expression) filter in the query field to capture long-tail informational search patterns. Try using
^ (who|what|why|how|where)to instantly view all the question-based queries your site currently ranks for. This lets you quickly uncover high-intent content expansion ideas.
Mastering Keyword Research and CTR Optimization
Many marketers rely on external, third-party estimation platforms for keyword research. However, the most accurate keyword tool available is your own active dashboard, filled with real data drawn directly from actual search behavior.
Spotting Striking-Distance Keywords
A striking-distance keyword is an organic search phrase where your website currently ranks near the bottom of page one or on page two of Google’s search results (typically positions 7 through 15). These pages are receiving steady search impressions but minimal clicks.
To extract these low-hanging ranking opportunities, follow this quick diagnostic routine:
- Open your Performance Report and enable all four core metric checkboxes.
- Apply a filter to isolate your main informational blog directory or specific core service pages.
- Sort the bottom data table by Impressions in descending order.
- Scan the list to locate high-impression keywords where the average position sits between 7 and 14.
- Note these target terms; they are prime candidates for on-page content optimization.
Fixing Poor Click-Through Rates
When a URL ranks prominently on the first page of Google but pulls in a lower CTR than the average for that position, it signals a clear issue with the user-facing snippet. The title tag or meta description is likely failing to attract the user’s attention.
High Impressions + Poor Click-Through Rate (CTR)
  ↳ Action Needed: Optimize Meta Title, Description, and Rich Snippets
To fix this, review the snippet through the eyes of a searching user. Is the value proposition clear? Does it feature a compelling call-to-action? Is the title truncated or cut off because it exceeds length limits?
Revise uninspiring titles by injecting primary keywords naturally near the beginning, and use numbers or bracketed additions to boost visual prominence. Update meta descriptions to clearly outline what the reader will gain by clicking through.
Tracking Search Consolidation Trends
Search engines continuously update how they group related keyword variations together. By monitoring the Queries tab over multiple quarters, you can observe whether Google is associating a single URL with an increasingly diverse array of semantic synonyms.
If you notice a page gaining impressions for a closely related phrase that isn’t explicitly mentioned on the page, update that content to incorporate the missing term. This simple step helps solidify your contextual relevance across the entire topic.
Diagnosing Google Search Console Indexing Obstacles
If Google cannot successfully discover, parse, and store your web content within its index, your site simply will not rank. The Pages report under the Indexing menu serves as your primary diagnostic tool to spot structural errors that hold back your search visibility.
Navigating the Pages Report
The Indexing status dashboard breaks down your absolute URL count into two distinct, high-level buckets: Indexed (pages successfully stored in Google’s database and eligible to rank) and Not Indexed (pages discovered but excluded from search availability).
While seeing a high number of unindexed pages can look alarming, many exclusions are entirely intentional. For example, you want utility directories like admin login pages, tag archives, or duplicate checkout parameters left out of public search results.
       [ Pages Report Dashboard ]
              /          \
      [ Indexed ]      [ Not Indexed ]
      (Eligible to     (Excluded or
        Rank)            Errored)
Analyzing Common Excluded Statuses
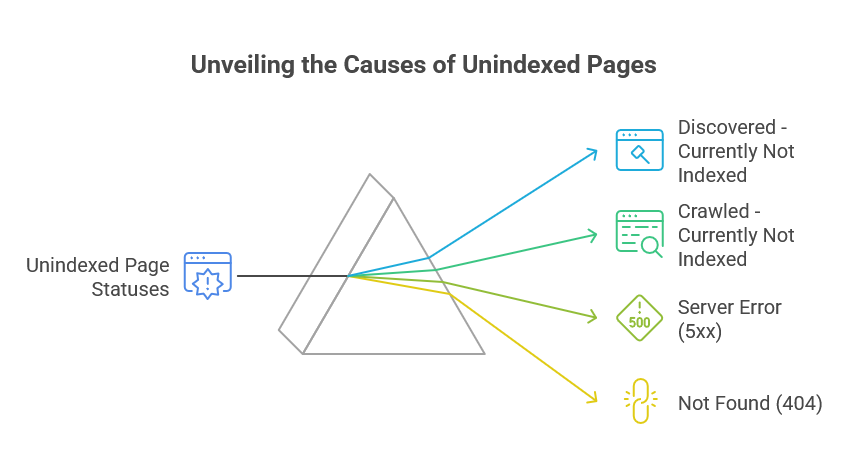
To keep your site healthy, you need to understand the underlying technical causes behind common unindexed page statuses. This understanding allows you to apply the correct technical fix:
- Discovered – currently not indexed: Google knows these URLs exist, but it hasn’t found time to crawl them yet. This delay often points to broader server capacity limits or a strained crawl budget across larger websites.
- Crawled – currently not indexed: Google has successfully fetched and reviewed the page layout, but decided not to add it to the search index. This usually indicates the content feels thin, unoriginal, or lacks meaningful value for searchers.
- Server error (5xx): Google’s web crawlers hit a hard wall because your hosting infrastructure failed to respond. This points to temporary server crashes, bad database connections, or resource-heavy scripts timing out.
- Not found (404): These are broken or dead URLs that no longer exist on your live server ecosystem.
Resolving Crawl Budget Bottlenecks
Your crawl budget represents the maximum number of individual pages Googlebot will attempt to crawl on your website during a given timeframe. If your architecture is cluttered with low-value, duplicate URLs, you risk exhausting this crawl allocation before Google ever discovers your primary revenue-driving pages.
To optimize your crawl path, implement clean parameter handling configurations within your robots.txt file to block crawlers from useless tracking variables. Regularly audit internal links to eradicate broken paths, and make sure every page you want visible features high-quality content.
For advanced optimization support, partnering with a specialized WordPress SEO Services ensures your underlying technical infrastructure remains organized and easy for search engine crawlers to navigate.
Maximizing Sitemaps and the URL Inspection Tool
Directing search engine crawlers manually is far more effective than waiting for them to stumble across your content updates on their own. By masterfully controlling sitemaps and using real-time inspection utilities, you can dramatically cut down the time it takes for new updates to go live in search results.
Submitting Clean XML Sitemaps
An XML sitemap acts as a clear roadmap that guides Googlebot directly to your most important, canonical pages. To prevent crawling confusion, you should only include URLs that return clean 200 OK status codes and are intended for public indexation.
Step 1: Generate clean sitemap XML url (via SEO plugin).
Step 2: Enter 'sitemap_index.xml' into Sitemaps tab.
Step 3: Monitor for green "Success" confirmation status.
Never include tracking parameters, duplicate canonical variants, or old URLs that redirect elsewhere inside your primary sitemap file. Once your sitemap is generated by a reliable plugin, enter the filename string into the Sitemaps text field and click submit. Review the dashboard regularly to ensure it consistently displays a successful status.
Real-Time Diagnostics via URL Inspection
The search bar at the very top of your console dashboard houses the URL Inspection tool. When you paste an individual URL into this field, you trigger a live diagnostic check that pulls data directly from Google’s index.
+--------------------------------------------------------------+
|                    URL INSPECTION CHECKLIST                  |
+--------------------------------------------------------------+
| [✓] Presence: Is the target URL live on Google's index?      |
| [✓] Mobile: Does the page pass mobile usability standards?    |
| [✓] Canonical: Is Google picking the same URL you defined?   |
| [✓] Coverage: Did the crawler run into rendering obstacles? |
+--------------------------------------------------------------+
This panel shows you exactly when the page was last crawled, which bot analyzed it, whether it passes mobile friendliness standards, and if it aligns with your declared canonical settings. If your live page layout looks correct but the index data shows an older version, use the “Request Indexing” link to place that URL back at the front of the re-crawl queue.
Testing Live Render Configurations
When diagnosing tricky layout issues, clicking the “Test Live URL” button in the upper right corner provides a real-time look at how Googlebot sees your page. This step is critical because it reveals whether certain JavaScript frameworks, CSS sheets, or security setups are accidentally blocking Googlebot from reading your actual text.
Review the rendered screenshot and look over any loaded resource errors. This helps ensure your content isn’t invisible to search engine crawlers.
Elevating Page Experience and Core Web Vitals
Modern search algorithms place immense value on user experience. Google explicitly quantifies these experience expectations through the Core Web Vitals framework. This initiative measures real-world loading speed, visual stability, and interactivity across your entire web layout.
Breaking Down the Three Core Pillars
The Core Web Vitals report segments your URLs based on real-world Chrome User Experience Report (CrUX) metrics. It groups performance into three clear buckets: Good, Needs Improvement, or Poor. To maintain high organic rankings, you must master the optimization targets for each metric pillar:
- Largest Contentful Paint (LCP): This measures pure loading performance. It tracks how long it takes for the largest primary content block or hero image on the screen to become visible to the user. For a “Good” rating, aim to keep this under 2.5 seconds.
- Interaction to Next Paint (INP): This tracks responsiveness by measuring the delay when a user clicks a button, taps a link, or interacts with an element on your page. To provide a snappy experience, keep this under 200 milliseconds.
- Cumulative Layout Shift (CLS): This measures visual stability. It calculates whether elements unexpectedly shift around on the screen while the page is loading, which often causes frustrating accidental clicks. Your target score should remain below 0.1.
| Core Web Vital Metric | Definition | Target for “Good” Rating | Common Fixes |
| LCP (Largest Contentful Paint) | Measures perceived loading speed | $\le$ 2.5 Seconds | Optimize images, implement caching, use a CDN |
| INP (Interaction to Next Paint) | Measures user interaction delays | $\le$ 200 Milliseconds | Defer non-essential JavaScript, break up long tasks |
| CLS (Cumulative Layout Shift) | Measures structural visual stability | $\le$ 0.1 | Set explicit dimensions on images, avoid dynamic text injection |
Resolving Mobile Usability Failures
With the vast majority of web traffic originating from smartphones, mobile usability remains a foundational ranking requirement. The Mobile Usability report flags layout issues that harm the mobile browsing experience.
Common red flags include “Text too small to read,” which means your font sizes force users to pinch and zoom, or “Clickable elements too close together,” which happens when buttons are packed so tightly that users accidentally tap the wrong link. Fix these issues within your global CSS stylesheets to prevent mobile ranking drops.
HTTPS and Security Hygiene
A secure site is a trusted site. Search Console monitors security settings across your property. If your site displays security warnings or mixed content errors (loading insecure http assets on an otherwise secure https page), address these configuration flaws immediately.
Ensuring clean security settings protects user data and preserves your hard-earned organic visibility.
Maximizing Advanced Analytics, Security, and Schema Tracking
Beyond everyday keyword tracking and standard indexing checks, intermediate and expert SEO professionals leverage Search Console’s advanced modules. These specialized features protect site health, track rich data enhancements, and extract deep query insights.
Monitoring Rich Snippets and Schema Validation
Implementing structured data markup helps search engines better understand the context of your content, which can earn your site eye-catching rich snippets in search results. When you add review stars, product details, or FAQ schema to a page, Search Console opens dedicated enhancement reports to track them.
       [ Enhanced Schema Tracking ]
         /           |            \
  [ Review Stars ] [ FAQ Accords ] [ Product Data ]
         \           |            /
     [ Automated Error Validation Alerts ]
These enhancement dashboards highlight any structural syntax errors, such as missing fields or formatting issues, that prevent your rich snippets from showing up. Keeping these reports error-free helps your listings stand out and capture more clicks in competitive search results.
Handling Security and Manual Actions
The Manual Actions tab is one of the most critical sections to monitor. If a site violates Google’s quality guidelines through black-hat tactics like unnatural link building or scraped content, human reviewers at Google can issue a manual penalty. This penalty will suppress or entirely remove those URLs from search results.
The adjacent Security Issues tab alerts you to serious external threats, such as malware injections, phishing scripts, or unauthorized hacks. If an alert ever appears here, clean up the infected files immediately and submit a formal reconsideration request to restore your search standing.
Tracking Backlink Quality and Internal Link Equity
The Links report lists the websites that link to your content, showing you exactly which external domains point to your platform and which specific pages they target most. It also details your top internal linking structures.
If a high-priority service page has very few internal links pointing to it, it is missing out on valuable internal ranking authority. Update your site architecture to link to that page from your top-performing blog posts to spread ranking equity naturally across your domain.
Strategic Support for Sustainable Business Growth
Consistently tracking indexing errors, diagnosing core web vital issues, and analyzing massive keyword reports requires significant technical expertise, time, and attention to detail. For many growing brands, managing this alongside daily operations becomes overwhelming.
At WP Badgers, we remove the guesswork from your digital strategy. Our expert team handles technical audits, on-page content alignment, and deep search console management to help your business stand out in search results. Over the years, we have proudly helped more than 80 businesses grow online by turning confusing technical data into sustainable traffic and real revenue growth.
Frequently Asked Questions
What is the difference between Google Search Console and Google Analytics?
Google Search Console focuses entirely on internal search engine dynamics, tracking impressions, crawling errors, queries, and how indexable your site is. Google Analytics tracks user behavior after they arrive on your site, measuring pageviews, bounce rates, session durations, and conversions.
How often should I check my Search Console dashboard?
For standard small-to-medium business sites, a detailed weekly check is usually enough to catch new indexing issues and track keyword shifts. For high-volume e-commerce platforms or enterprise portals, monitor the dashboard daily to spot server errors or index drops immediately.
Why is there a difference in data between Search Console and GA4?
Search Console tracks raw search impressions and clicks directly from Google’s search engine results pages. Google Analytics relies on JavaScript triggers to track users landing on your site, which can sometimes be blocked by browser extensions, cookie choices, or script delays.
How do I submit a single new page for indexing quickly?
Open the URL Inspection tool at the top of the dashboard, paste the new URL into the search bar, and run the diagnostic check. If the page is not yet indexed, click the Request Indexing link to alert Google’s crawlers to visit the page.
What does the “Sitemap could not be read” error mean?
This error usually points to a temporary access issue or an incorrect file path string. Double-check that your sitemap URL loads correctly in an incognito window, verify it uses proper XML formatting, and ensure your server isn’t accidentally blocking Googlebot.
How far back does historical performance data go?
Google Search Console stores performance data for a rolling 16-month window. To track long-term year-over-year trends, export your query and page metrics regularly to external spreadsheets or connect your account to a BigQuery database.
Can a manual action penalty be reversed?
Yes. To reverse a manual action penalty, fix every underlying policy violation listed in the report, remove any low-quality elements or unnatural links, and submit a detailed Reconsideration Request explaining the steps you took to clean up the site.
Conclusion
Mastering Google Search Console is a fundamental requirement for anyone serious about growing their organic search presence. This platform bridges the gap between guessing what works and making precise, data-driven optimization decisions. By monitoring your performance reports, fixing indexing errors, and improving your Core Web Vitals, you build a healthy, highly visible website that search engines can easily understand.
WordPress SEO Services help improve your website’s visibility, rankings, and organic traffic. From on-page optimization and keyword targeting to technical SEO and performance improvements, professional WordPress SEO ensures your site attracts more visitors and achieves sustainable online growth.
Consistently monitoring these technical details is what separates growing brands from sites that struggle to gain traction. Take control of your data, optimize your content pieces systematically, and watch your search footprint expand.
Ready to unlock your website’s full organic potential? Contact WP Badgers today for a free SEO consultation and let our team build a high-performing search strategy tailored to your business goals.