
You run your site through PageSpeed Insights, see a decent score, and think, “Okay, we’re good.” But then a customer visits the site on their phone and says, “Why does this feel so slow?”
That happens more often than you might think.
The problem is that a good lab score doesn’t always mean your website feels fast to real people. There can be a pretty big difference between what a testing tool reports and what your visitors actually experience when they load your site on a phone, a slower connection, or an older device.
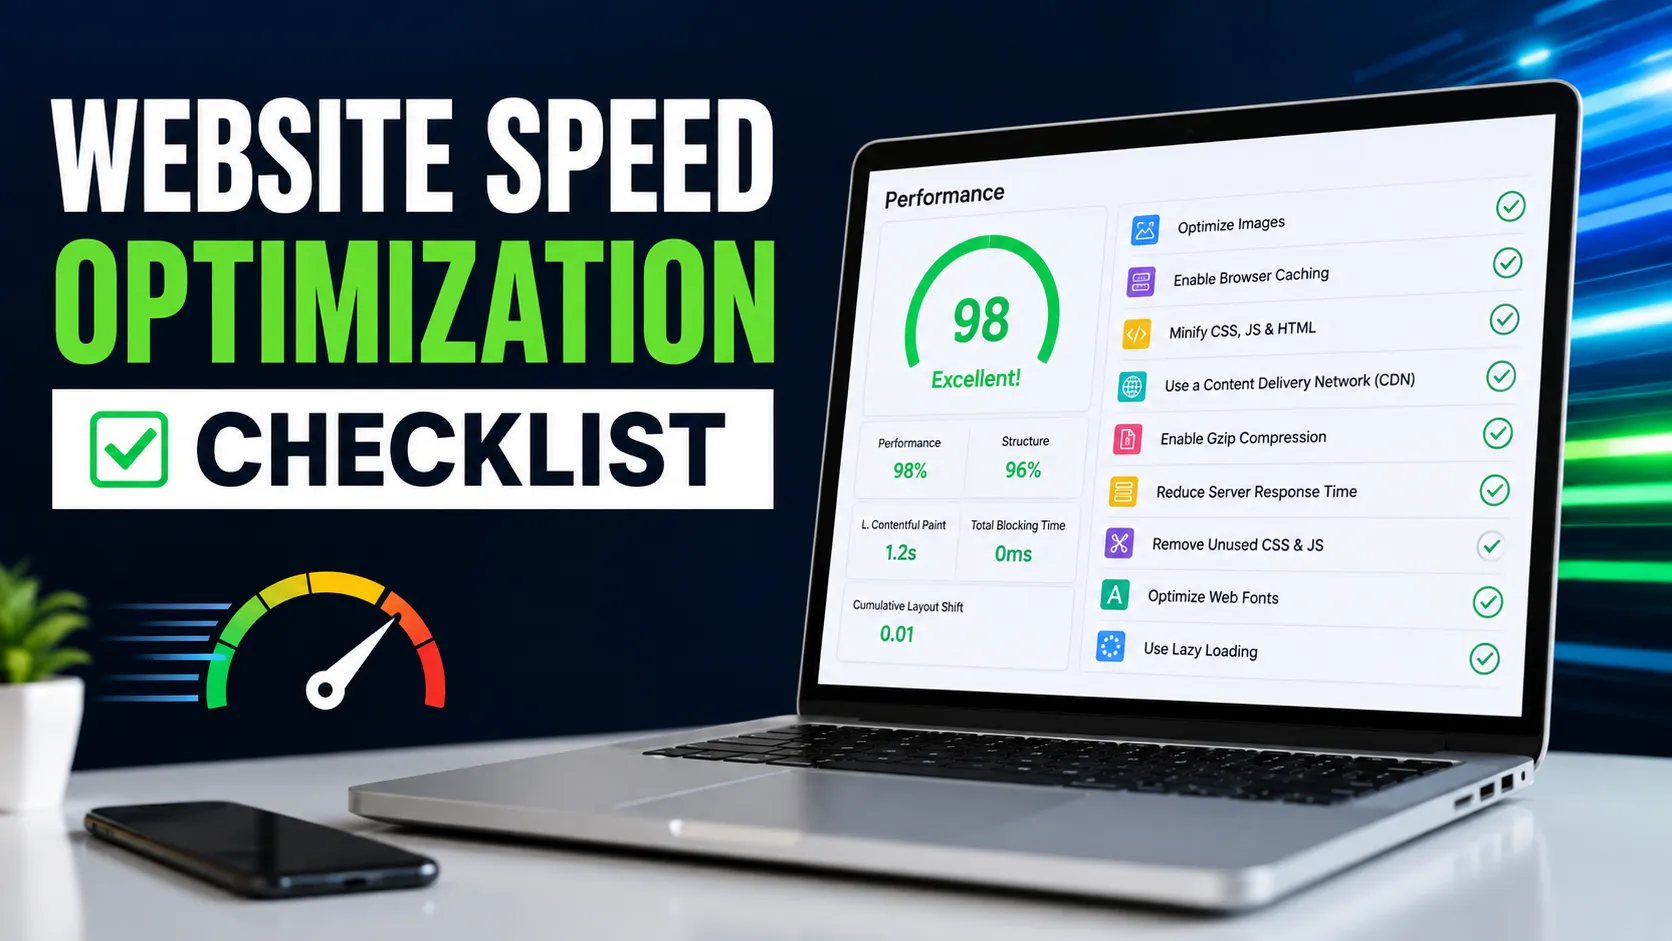
That’s exactly the gap this website speed optimization checklist is designed to address.
Website speed isn’t just about getting one high score anymore. There are several things that can affect how fast your site feels, including server response time, Core Web Vitals, image sizes, JavaScript, page structure, and overall mobile performance. And honestly, even small issues can add up and make a site feel frustratingly slow.
In 2026, real-world user experience matters more than ever. A slow website can hurt more than just your PageSpeed score. It can affect your search visibility, make visitors lose trust, increase bounce rates, and ultimately cost you leads or sales.
So, rather than throwing a bunch of technical terms at you, this guide breaks everything down into a practical website speed optimization checklist you can actually work through.
We’ll cover what you should check, why it matters, what you can fix yourself, and when it makes sense to bring in a professional. Whether your site feels slow on mobile, your Core Web Vitals need work, or you simply want pages to load faster, this checklist will help you figure out where to start.
What Is a Website Speed Optimization Checklist?
A website speed optimization checklist is a structured list of technical and design factors that affect how quickly a website loads and responds to user interaction. It typically covers server performance, Core Web Vitals, image and asset optimization, caching, and mobile performance.
Instead of chasing a single score, a proper checklist looks at speed from multiple angles: how fast the first byte arrives, how quickly the main content becomes visible, how responsive the page feels when someone taps a button, and whether the layout stays stable while everything loads. Each of these affects user experience and SEO differently, which is why a one-metric approach usually falls short.
Why Website Speed Matters More in 2026
Speed has always mattered, but a few things have changed the stakes.
User experience. Visitors expect near-instant feedback, especially on mobile. A page that loads in 1.5 seconds versus 4 seconds isn’t a minor difference – it’s the difference between someone browsing and someone bouncing.
SEO. Google has used page experience signals, including Core Web Vitals, as part of ranking for years. Speed alone won’t outrank thin or irrelevant content, but a slow, unstable page can hold back an otherwise strong one.
Mobile browsing. Most traffic for many businesses now comes from mobile devices, often on inconsistent networks. A site optimized only for desktop is optimized for a shrinking share of visitors.
Conversions. Cart abandonment, form drop-off, and bounce rates all climb as load time increases, particularly during the first few seconds of a visit.
Engagement and credibility. A sluggish site reads as outdated or untrustworthy, even if the content and design are solid.
Core Web Vitals. These are Google’s specific measurements of loading, responsiveness, and visual stability, and they’ve become a standard reference point for what “fast” actually means.
Put together, speed is no longer a nice-to-have technical detail. It’s a factor that touches SEO, UX, and revenue at the same time.
Website Speed Optimization Checklist: 15+ Things to Check
Here’s the working checklist. Each item explains what to check, why it matters, what you can do about it, and when it’s worth calling in a developer.
1. Test your website speed on mobile
What to check: Run your homepage and key landing pages through a mobile-specific speed test, not just desktop.
Why it matters: Mobile devices generally have less processing power and slower networks than desktops, so mobile performance is usually the real bottleneck.
What to do: Use Google PageSpeed Insights or Lighthouse in mobile mode and note LCP, INP, and CLS separately from desktop results.
When to call a pro: If mobile scores are dramatically worse than desktop, that gap often points to unoptimized images or heavy JavaScript that a developer will need to address directly.
2. Test desktop performance
What to check: Desktop load time and Core Web Vitals, separately from mobile.
Why it matters: Desktop visitors still matter for many B2B sites, SaaS products, and higher-ticket purchases where people research on a larger screen.
What to do: Run the same tools in desktop mode and compare against your mobile results to spot device-specific issues.
3. Check Core Web Vitals
What to check: LCP, INP, and CLS for your most important pages — homepage, product pages, blog posts that drive traffic.
Why it matters: These three metrics are Google’s standardized way of measuring real-world loading, interactivity, and stability.
What to do: Use PageSpeed Insights, which pulls both lab data and real-user field data when available. We cover targets for each metric in the next section.
4. Measure Time to First Byte (TTFB)
What to check: How long it takes your server to respond to the very first request before any content starts loading.
Why it matters: Everything else — rendering, scripts, images — is delayed if TTFB is slow. A weak hosting setup or unoptimized server can cap your speed no matter what else you fix.
What to do: Check TTFB in WebPageTest or Chrome DevTools. Under 200ms is generally considered good; anything over 600ms usually points to a hosting or server configuration issue.
When to call a pro: Persistent high TTFB across pages often means the fix is at the server or hosting level, not something a plugin can solve.
5. Optimize images
What to check: File sizes, dimensions, and formats of images across your site, especially above-the-fold ones.
Why it matters: Images are frequently the single largest contributor to page weight, and oversized images directly hurt LCP.
What to do: Resize images to the dimensions they’re actually displayed at, and compress them before uploading rather than relying only on plugins to fix it after the fact.
6. Use modern image formats where appropriate
What to check: Whether your images are still using older formats like JPEG or PNG when WebP or AVIF would work.
Why it matters: Modern formats can reduce file size significantly at similar visual quality, which speeds up loading without sacrificing appearance.
What to do: Convert key images to WebP or AVIF, with a fallback for older browsers if needed. Many image optimization tools handle this conversion automatically.
7. Implement lazy loading
What to check: Whether images and videos below the fold load immediately or only as the user scrolls to them.
Why it matters: Loading everything upfront wastes bandwidth and slows down initial page render, especially on long pages.
What to do: Enable lazy loading for below-the-fold media, but avoid lazy loading your main hero image or LCP element, since that can actually delay it.
8. Minify CSS
What to check: Whether your CSS files still contain unnecessary whitespace, comments, and formatting meant for human readability.
Why it matters: Minification reduces file size, which speeds up download and parsing time, particularly on mobile connections.
What to do: Use a minification tool or plugin to strip unnecessary characters from CSS files without changing functionality.
9. Minify JavaScript
What to check: Same idea as CSS — unminified JavaScript files sitting on your server as-is.
Why it matters: JavaScript is often the heaviest asset type on a page, so shaving file size here has a real impact on load time.
What to do: Minify JS files through a build process or plugin, and test thoroughly afterward since JS minification can occasionally break functionality if done incorrectly.
10. Remove unnecessary JavaScript
What to check: Scripts running on pages where they aren’t needed — a booking plugin loading on your blog, for example.
Why it matters: Unused JavaScript still gets downloaded and parsed, which delays interactivity and hurts INP.
What to do: Audit which scripts load on which pages and disable or conditionally load ones that aren’t necessary site-wide.
When to call a pro: Untangling script dependencies without breaking site functionality is one of the more technical parts of a speed audit and often benefits from developer eyes.
11. Reduce render-blocking resources
What to check: CSS and JavaScript files that block the browser from rendering the page until they’ve fully loaded.
Why it matters: Render-blocking resources directly delay when visitors see meaningful content, which affects LCP and perceived speed.
What to do: Defer non-critical JavaScript, load critical CSS inline, and load the rest asynchronously where possible.
12. Optimize fonts
What to check: How many font files and weights your site loads, and whether they’re hosted efficiently.
Why it matters: Web fonts can add render delay and layout shift if they’re not loaded and displayed correctly.
What to do: Limit the number of font weights and styles in use, use font-display: swap, and consider self-hosting fonts instead of pulling from external services.
13. Enable browser caching
What to check: Whether returning visitors’ browsers are storing static assets locally instead of re-downloading them every visit.
Why it matters: Proper caching makes repeat visits noticeably faster, which matters for engagement and lowers server load.
What to do: Set appropriate cache-control headers or use a caching plugin that handles this automatically.
14. Use a CDN
What to check: Whether static assets are served from a server geographically close to your visitors or from a single origin server.
Why it matters: A content delivery network (CDN) distributes your files across multiple global locations, cutting down the distance data has to travel.
What to do: Set up a CDN for images, CSS, JavaScript, and other static assets, particularly if you have visitors spread across different regions.
15. Improve server response time
What to check: How your hosting environment performs under normal and peak traffic.
Why it matters: No amount of front-end optimization fully compensates for a slow, overloaded, or under-resourced server.
What to do: Monitor response times during traffic spikes and compare against your baseline TTFB numbers.
When to call a pro: If your server consistently struggles, this usually points to a hosting or infrastructure decision rather than a quick fix.
16. Review hosting performance
What to check: Whether your current hosting plan and provider are actually suited to your traffic and site complexity.
Why it matters: Shared, underpowered, or poorly configured hosting is one of the most common root causes behind sites that stay slow despite front-end fixes.
What to do: Compare your current hosting specs and performance against your actual traffic needs, and consider managed WordPress hosting if you’re on generic shared hosting.
17. Optimize WordPress plugins
What to check: Which plugins are active, how many there are, and whether any are known to add significant load.
Why it matters: Every active plugin adds some combination of database queries, CSS, and JavaScript, and it adds up quickly.
What to do: Review your plugin list and test site speed with individual plugins temporarily disabled to identify heavy ones.
18. Remove unused plugins and themes
What to check: Inactive plugins and themes still sitting in your WordPress installation.
Why it matters: Even inactive plugins and themes can pose security risks and occasionally still affect performance or database size.
What to do: Delete anything you’re not actively using, after confirming it’s safe to remove.
19. Optimize the WordPress database
What to check: Post revisions, spam comments, transient options, and other accumulated database bloat.
Why it matters: A bloated database slows down queries, which increases server response time across the entire site.
What to do: Clean up old revisions and unnecessary data periodically, and consider limiting post revisions going forward.
When to call a pro: Database cleanup on a live production site carries real risk if done incorrectly – this is a good candidate for professional handling, especially on larger sites.
20. Reduce third-party scripts
What to check: Chat widgets, analytics tools, ad scripts, social embeds, and other third-party code running on your site.
Why it matters: Third-party scripts are often the least optimized part of a page and are outside your direct control, making them a common cause of slow INP.
What to do: Audit which third-party scripts are actually delivering value and remove or defer the rest.
21. Optimize redirects
What to check: Chains of multiple redirects (A to B to C) instead of direct redirects.
Why it matters: Each redirect adds a round trip to the server, adding delay before the final page even starts loading.
What to do: Update internal links and redirect rules to point directly to the final destination URL.
22. Enable compression
What to check: Whether your server is compressing text-based files like HTML, CSS, and JavaScript before sending them to the browser.
Why it matters: Compression (typically Gzip or Brotli) can significantly reduce file transfer size with no visible quality loss.
What to do: Confirm compression is enabled at the server level, which most modern hosts and CDNs support by default.
23. Improve mobile performance specifically
What to check: Mobile-specific issues like tap target sizing, viewport configuration, and mobile-only heavy elements.
Why it matters: Mobile users often deal with slower networks and less powerful devices, so issues that are minor on desktop can be significant on mobile.
What to do: Test on real mid-range devices when possible, not just simulated throttling, since real-world performance can differ.
24. Re-test after every change
What to check: Speed and Core Web Vitals after each significant change, not just once at the end.
Why it matters: Optimization isn’t always additive – one fix can occasionally offset or interact with another, so testing in isolation helps you understand real impact.
What to do: Re-run your speed tests after each major change and keep a simple log of scores over time.
Understanding Core Web Vitals
Core Web Vitals are three specific metrics Google uses to measure real-world page experience: loading speed, interactivity, and visual stability.
| Metric | What It Measures | Good Target | Common Problems |
| LCP (Largest Contentful Paint) | How quickly the largest visible content element loads | 2.5 seconds or less | Oversized hero images, slow server response, render-blocking resources |
| INP (Interaction to Next Paint) | How quickly the page responds to user interactions like clicks or taps | 200 milliseconds or less | Heavy JavaScript execution, long main-thread tasks, unnecessary third-party scripts |
| CLS (Cumulative Layout Shift) | How much visible content shifts around unexpectedly while loading | 0.1 or less | Images without dimensions, ads or embeds injected without reserved space, late-loading fonts |
A quick note worth clarifying: INP replaced First Input Delay (FID) as the official responsiveness metric. FID only measured the delay before the first interaction; INP measures responsiveness across the entire page visit, which makes it a more complete picture of how a page actually feels to use.
How to Perform a Technical Speed Audit
A technical speed audit is a structured process for identifying exactly what’s slowing a website down, rather than guessing based on a single score. Here’s a practical workflow.
- Run baseline tests. Record your current scores before changing anything, so you have something to measure against.
- Test mobile and desktop separately. Don’t assume one reflects the other.
- Review Core Web Vitals. Note LCP, INP, and CLS for your key pages specifically, not just the homepage.
- Analyze server response time. Check TTFB and how it holds up under load.
- Identify heavy assets. Look for oversized images, large JavaScript bundles, and unoptimized fonts.
- Check JavaScript and CSS. Look for render-blocking files, unminified code, and unused scripts.
- Review images. Confirm proper sizing, compression, and format.
- Check caching and CDN setup. Verify static assets are cached and served efficiently.
- Review third-party scripts. Identify which ones are actually necessary.
- Implement fixes. Prioritize based on impact and how risky each change is.
- Re-test. Confirm the changes actually improved performance rather than assuming they did.
- Monitor performance over time. Speed can regress after content updates, plugin changes, or theme edits, so this isn’t a one-time task.
This is the kind of workflow that benefits from consistency – a technical speed audit done once a year catches far less than one built into your regular maintenance routine.
How to Improve Your Website Loading Time
Once you know what’s slowing your site down, the fixes generally fall into two categories: low-risk changes you can often make yourself, and changes that benefit from developer involvement.
Lower-risk improvements:
- Compressing and resizing images before upload
- Enabling browser caching through a plugin
- Removing plugins and scripts you don’t actually use
- Enabling compression at the hosting level
- Cleaning up simple database bloat like spam comments
Changes that typically need a developer:
- Fixing render-blocking JavaScript and CSS
- Resolving plugin conflicts affecting performance
- Restructuring database queries
- Migrating to better-suited hosting
- Diagnosing why INP stays high despite front-end fixes
Trying to improve loading time by making every change at once makes it hard to know what actually worked. Change one or two things, re-test, and move to the next item.
Recommended Speed Testing Tools
Google PageSpeed Insights combines lab data with real-user field data when available, and it’s a solid starting point for understanding both Core Web Vitals and specific improvement opportunities.
Lighthouse (built into Chrome DevTools or available standalone) runs a detailed lab-based audit and is useful for testing changes locally before they go live.
Chrome DevTools lets you inspect network requests, rendering behavior, and JavaScript execution directly, which is useful once you’re past basic scores and into diagnosing specific bottlenecks.
GTmetrix provides waterfall charts showing exactly how and when each resource loads, which helps pinpoint which specific files are causing delays.
WebPageTest allows testing from multiple global locations and device types, useful if your traffic is geographically spread out or you need to compare performance across regions.
No single tool tells the whole story. A real audit usually cross-references two or three of these to confirm findings before making changes.
WordPress Website Speed Optimization Checklist
WordPress powers a large share of the web, and its flexibility is also what makes it prone to speed problems if it isn’t maintained carefully.
Hosting. Choose hosting suited to WordPress specifically, not generic shared hosting stretched across unrelated platforms. Managed WordPress hosting typically includes server-level caching and optimization built in.
Plugin audit. Review every active plugin periodically. More plugins generally means more database queries, more scripts, and more potential conflicts.
Theme optimization. Bloated, feature-heavy themes can slow a site down even before you add content. Lightweight, well-coded themes tend to perform better out of the box.
Image optimization. This applies just as much to WordPress as any other platform -compress and properly size images before or during upload.
Caching. Page caching, object caching, and browser caching each address different parts of the load process, and a good WordPress setup typically uses more than one.
CDN. Serving static assets through a CDN reduces load on your WordPress server and speeds up delivery to visitors in different regions.
Database cleanup. WordPress accumulates revisions, transients, and orphaned data over time. Periodic cleanup keeps queries running efficiently.
CSS/JS optimization. Minification and reducing render-blocking resources apply directly to how WordPress themes and plugins output code.
Removing unused plugins. Deactivated isn’t the same as removed — unused plugins should be deleted, not just turned off.
Limiting third-party scripts. Chat widgets, tracking pixels, and embedded content are common in WordPress sites and are worth auditing regularly.
Updating carefully. Keep WordPress core, themes, and plugins updated, but test updates on staging first when possible, since updates can occasionally introduce new performance issues.
Monitoring after updates. Re-check speed and Core Web Vitals after any significant update, rather than assuming performance stayed the same.
Common Website Speed Optimization Mistakes to Avoid
- Chasing a perfect PageSpeed score. A 100/100 score doesn’t guarantee a great real-world experience, and pursuing it can lead to diminishing returns.
- Optimizing only desktop performance. Most traffic is mobile for many sites – desktop-only optimization misses the majority of visitors.
- Ignoring mobile users entirely. Beyond just testing, actual mobile usability (tap targets, viewport, readable text) affects performance perception too.
- Installing too many optimization plugins. Stacking multiple caching or optimization plugins can conflict and sometimes slow a site down instead of speeding it up.
- Compressing images without checking quality. Over-compression can leave images looking noticeably worse, which hurts the user experience you were trying to improve.
- Ignoring hosting and server performance. Front-end fixes have limits if the underlying server is the actual bottleneck.
- Leaving third-party scripts unchecked. These are often the biggest hidden contributor to poor INP scores.
- Making changes without testing. Skipping the re-test step means you’re optimizing based on assumptions, not results.
- Focusing only on one metric. A great LCP score doesn’t mean much if CLS or INP are still poor.
Website Speed Optimization Checklist Table
| Check | What to Look For | Recommended Action | Priority |
| Mobile speed test | Slow LCP/INP on mobile | Run PageSpeed Insights in mobile mode | High |
| Core Web Vitals | LCP, INP, CLS outside good ranges | Address root cause per metric | High |
| TTFB | Response time over 600ms | Review hosting/server configuration | High |
| Image optimization | Oversized, uncompressed images | Resize and compress before upload | High |
| Render-blocking resources | CSS/JS blocking initial render | Defer or inline critical resources | High |
| Caching | No browser or page caching | Enable caching plugin or server rules | Medium |
| CDN | Assets served from single origin | Set up a CDN for static files | Medium |
| Plugin audit | Excessive or unused plugins | Deactivate and delete unnecessary ones | Medium |
| Database cleanup | Bloated revisions and transients | Clean up periodically | Medium |
| Third-party scripts | Unnecessary chat/ad/tracking scripts | Audit and remove low-value scripts | Medium |
| Font optimization | Multiple unused font weights | Limit weights, use font-display: swap | Low |
| Redirect chains | Multiple hops per redirect | Point directly to final URL | Low |
When Should You Hire a Website Speed Optimization Expert?
Some speed issues are quick fixes. Others are symptoms of deeper technical problems that keep resurfacing no matter how many plugins you install. It’s worth bringing in a professional when:
- Your site stays slow despite trying common fixes
- Core Web Vitals remain poor across multiple pages
- Server response time is consistently high
- You’re dealing with complex JavaScript issues you can’t isolate
- Plugin conflicts are affecting performance in unclear ways
- You run a large eCommerce site where speed directly affects revenue
- WordPress-specific technical issues go beyond basic settings
- Speed problems return shortly after you fix them
- You don’t have in-house technical resources to diagnose the issue properly
In a real-world speed audit, a high PageSpeed score doesn’t always mean the website feels fast to actual users – lab tests and real-user experience can tell different stories, and untangling that difference is often where outside expertise helps most.
Not sure which speed issues are actually slowing your site down? WP Badgers can review your website and identify the technical issues affecting performance and technical SEO. Get a Free Website Audit to see what should be fixed first.
Frequently Asked Questions
What is a website speed optimization checklist?
It’s a structured set of technical and design factors — server response time, Core Web Vitals, images, scripts, and caching — that together determine how fast and responsive a website feels to real visitors.
What is a good website loading time in 2026?
Most experts consider a load time under 2.5 seconds for LCP, an INP under 200 milliseconds, and a CLS under 0.1 to reflect a good user experience, though exact targets vary somewhat by site type and content.
How do I improve my website loading time?
Start with image optimization, caching, and removing unused plugins or scripts, since these typically offer the biggest improvement for the least risk. More complex issues, like server response time or JavaScript bloat, often need developer attention.
Does website speed affect SEO?
Yes. Google uses Core Web Vitals and page experience signals as part of ranking, and slow sites also tend to have higher bounce rates, which can indirectly affect how search engines evaluate content relevance.
What should a technical speed audit include?
A full audit should cover mobile and desktop testing, Core Web Vitals, server response time, image and script analysis, caching and CDN setup, and a re-test after fixes are implemented.
How can I check my website speed?
Tools like Google PageSpeed Insights, Lighthouse, GTmetrix, and WebPageTest all provide speed testing, each with slightly different strengths depending on what you’re trying to diagnose.
Why is my WordPress website slow?
Common causes include unoptimized images, too many active plugins, poor-quality hosting, unminified CSS/JS, and database bloat from accumulated revisions and transient data.
How often should I perform a website speed audit?
A full audit at least twice a year is reasonable for most sites, with lighter checks after any major update, redesign, or significant traffic change.
Do Core Web Vitals affect website rankings?
They’re one of several page experience signals Google considers, though strong content relevance still matters more overall. Poor Core Web Vitals can hold back an otherwise competitive page.
Can a slow website reduce conversions?
Yes. Slower load times are consistently associated with higher bounce rates and lower conversion rates, particularly during the first few seconds of a visit when users decide whether to stay.
Final Thoughts
Website speed in 2026 isn’t about chasing one perfect score. It’s really about regularly checking the things that actually affect how fast your website feels to real people using real devices and different internet connections. A complete website speed optimization checklist can help you look at everything from server response time and Core Web Vitals to WordPress-specific maintenance, giving you a much clearer picture than relying on just one speed test.
And honestly, regular monitoring is just as important as making the initial fixes. Website performance can slowly take a hit after a plugin update, adding new content, installing scripts, or making other changes to your site. That’s why it’s a good idea to keep an eye on your performance and catch problems before they start affecting your visitors.
If your site still feels slow even after you’ve tried the usual fixes, professional optimization can make a big difference. It can help uncover what’s actually slowing things down instead of having you guess at the problem.
Not sure how your website is performing right now? WP Badgers can help you find out. Get a Free Website Audit and see exactly what’s affecting your site’s speed, performance, and user experience.